
Role
Confirm that the selected position and metric set reflect the work the player is being asked to do.
Put up to five players into one consistent view. Use position-relevant metrics, per-90 rates and percentile context to see where profiles genuinely differ.
Radar charts make the shape of a player’s output easy to scan. YouPro selects position-relevant metrics and shows percentile performance against the appropriate reference pool.
The matrix places exact per-90 values and percentiles side by side. It is better for checking where a visual impression comes from and comparing several shortlist options without switching profiles.
Free accounts can compare up to three players across the top five leagues. Pro unlocks comparison of up to five players and broader league coverage.
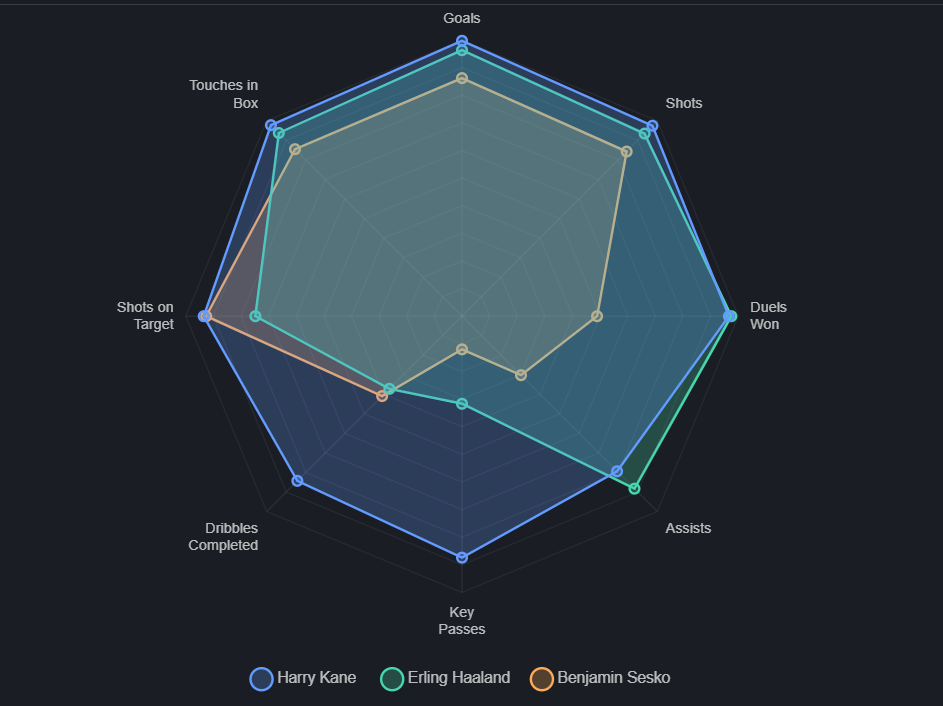
Confirm that the selected position and metric set reflect the work the player is being asked to do.
Review minutes and season context. High rates across limited playing time should be treated as an investigation signal.
Use league, team and match context before assuming that similar numbers represent identical performance conditions.
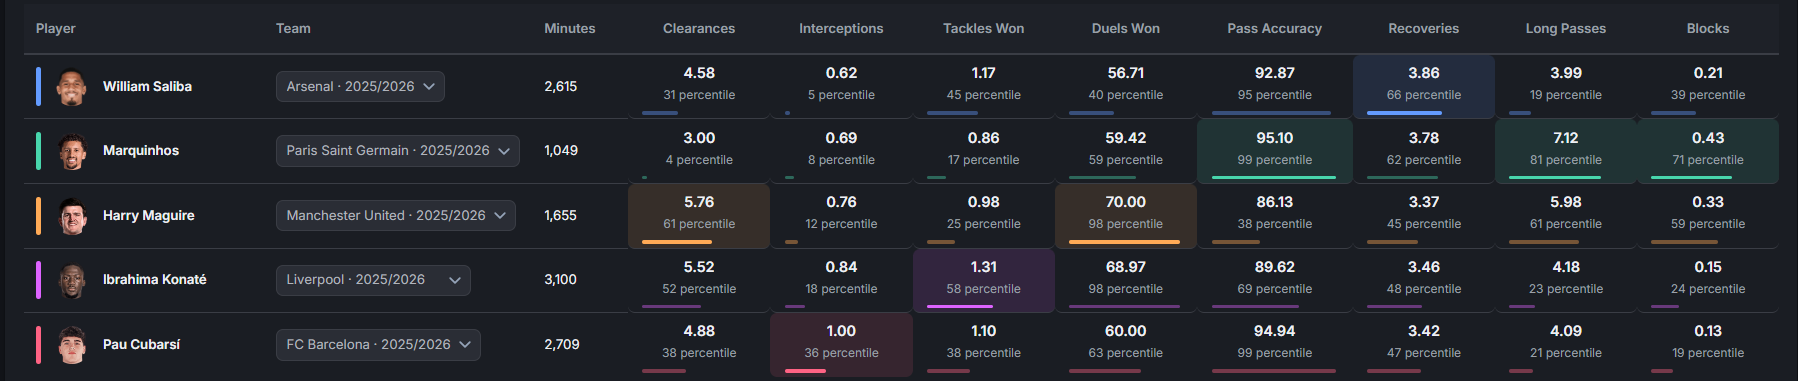
Start with three-player radar comparison for free, then unlock the complete five-player view with Pro.
Start comparing ↗